
How much should someone in Singapore be earning in their 20s, 30s or 40s?
There is no single answer. Two people of the same age can have vastly different salaries depending on their occupations, qualifications, experience and industries.
Still, official figures from the Ministry of Manpower (MOM) provide a useful benchmark for Singapore residents who want to see how their income compares with others.
According to MOM’s Labour Force in Singapore 2025 report, the median gross monthly income of full-time employed residents stood at $5,000 excluding employer CPF contributions.
When employer CPF contributions are included, the figure rises to $5,775, up 5% from $5,500 in 2024. MOM also reported that real median income, after accounting for inflation, increased by 4.1% in 2025.
But that overall figure of $5,000 masks substantial differences between workers.
Looking at the data by age, occupation and educational qualification paints a much more revealing picture.
First, What Does “Median Salary” Actually Mean?
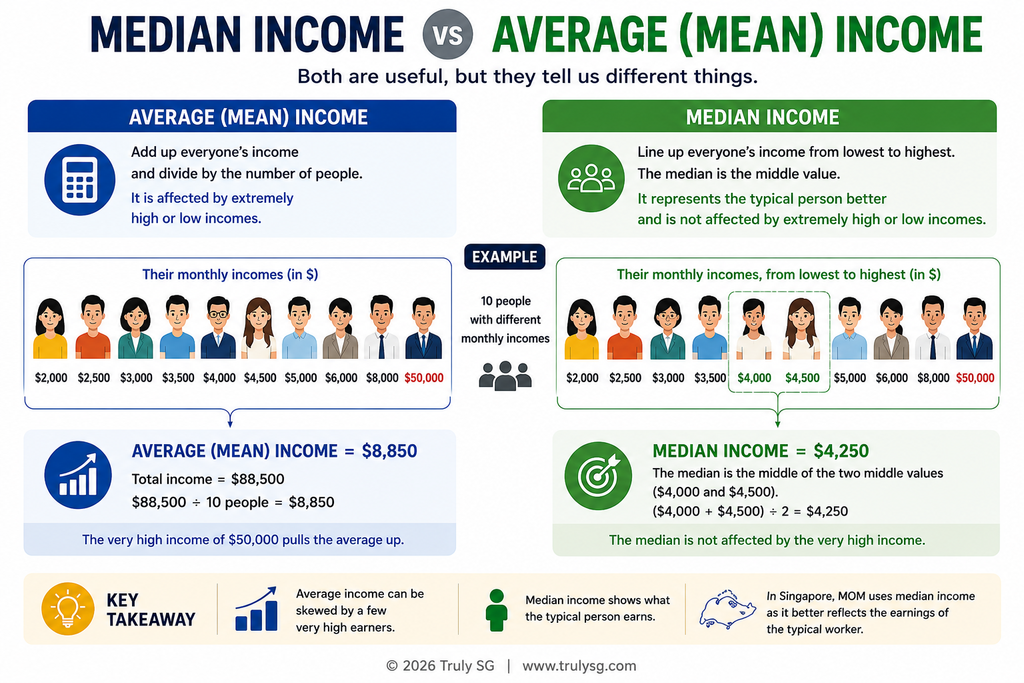
Before comparing the numbers, it is important to distinguish between the median and the average.
If every worker were ranked according to income, the median represents the person in the middle — half earn more and half earn less.
This makes median income particularly useful when discussing salaries because exceptionally high earners have less influence on the figure than they would on a simple mathematical average.
The figures below refer to gross monthly income from employment excluding employer CPF contributions.
For employees, MOM defines this as gross wages or salaries before employee CPF contributions and personal income tax, including basic wages, overtime pay, commissions, tips, other allowances and one-twelfth of annual bonuses. The data covers Singapore citizens and permanent residents and excludes full-time National Servicemen.
In other words, these figures are closer to what most employees would recognise as their gross monthly salary than figures that include their employer’s CPF contribution.
How Much Do Singapore Workers Earn At Different Ages?
The differences are significant.
| Age Group | Median Gross Monthly Income |
|---|---|
| 15–19 | $1,600 |
| 20–24 | $2,813 |
| 25–29 | $4,333 |
| 30–34 | $5,417 |
| 35–39 | $6,250 |
| 40–44 | $6,750 |
| 45–49 | $6,608 |
| 50–54 | $5,958 |
| 55–59 | $4,410 |
| 60 & Over | $2,970 |
| All ages | $5,000 |
Source: Comprehensive Labour Force Survey, Manpower Research & Statistics Department, MOM.
The progression is particularly steep during the first decade or so of a person’s career.
Median income rises from $2,813 among workers aged 20 to 24 to $4,333 among those aged 25 to 29 — a difference of $1,520.
It climbs further to $5,417 for those aged 30 to 34 and $6,250 among workers aged 35 to 39.
The highest median is recorded among the 40-to-44 age group at $6,750.
After that, the pattern reverses.
Median income slips slightly to $6,608 among those aged 45 to 49 before falling more substantially to $5,958 for those aged 50 to 54, $4,410 for workers aged 55 to 59 and $2,970 for those aged 60 and above.
Why Comparing Yourself Only By Age Can Be Misleading
At first glance, someone in their late 30s earning $5,000 might conclude that they are significantly behind their peers because the median for their age group is $6,250.
But that conclusion could be completely wrong.
A person’s occupation makes an enormous difference.
The median for a manager in their late 30s, for example, bears little resemblance to that of a service worker or clerical support worker of exactly the same age.
This is where the MOM figures become particularly interesting.
Median Salary Varies Across Different Occupations For Different Age Groups
The table below compares workers not only by age but also by broad occupational group.
| Age | Managers & Admin | Professionals | Associate Professionals & Technicians | Clerical Support | Service & Sales | Craftsmen | Plant & Machine Operators | Cleaners & Labourers |
|---|---|---|---|---|---|---|---|---|
| 20–24 | S | $4,409 | $3,000 | $2,167 | $2,300 | S | S | S |
| 25–29 | $6,200 | $5,417 | $3,694 | $2,917 | $3,000 | $2,999 | $2,700 | $2,100 |
| 30–34 | $8,500 | $6,725 | $4,230 | $3,150 | $3,200 | $3,000 | $3,000 | $2,500 |
| 35–39 | $9,711 | $7,854 | $4,500 | $3,278 | $3,358 | $3,000 | $3,065 | $2,275 |
| 40–44 | $10,833 | $8,667 | $4,544 | $3,375 | $3,200 | $3,250 | $3,000 | $2,232 |
| 45–49 | $11,500 | $8,750 | $4,667 | $3,250 | $3,000 | $3,600 | $3,000 | $2,180 |
| 50–54 | $11,925 | $8,750 | $4,667 | $3,200 | $3,000 | $3,000 | $2,853 | $2,275 |
| 55–59 | $10,890 | $8,667 | $4,333 | $3,150 | $2,858 | $3,000 | $2,700 | $2,090 |
| 60 & Over | $9,000 | $7,908 | $4,000 | $2,788 | $2,500 | $2,489 | $2,300 | $1,900 |
| All ages | $10,183 | $7,500 | $4,209 | $3,000 | $2,900 | $2,917 | $2,708 | $2,000 |
S = data suppressed because of the small number of workers covered.
Source: Comprehensive Labour Force Survey, Manpower Research & Statistics Department, MOM.
The differences are striking.
Across all ages, managers and administrators have a median income of $10,183, more than double the overall median of $5,000.
Professionals are next at $7,500, while associate professionals and technicians have a median of $4,209.
At the other end, the median is $3,000 for clerical support workers, $2,900 for service and sales workers and $2,000 for cleaners, labourers and related workers.
Managers can continue seeing income growth well into their 40s
The age trajectory for managers is also quite different from the overall population.
Managers and administrators aged 25 to 29 have a median income of $6,200. This rises to $8,500 at 30 to 34, $9,711 at 35 to 39 and $10,833 at 40 to 44.
It continues increasing to $11,500 among those aged 45 to 49 and reaches $11,925 among those aged 50 to 54.
That is very different from the overall salary curve, which peaks earlier at 40 to 44.
Professionals show a similar pattern, although their salaries plateau at around $8,750 in their late 40s and early 50s.
The age effect is much smaller in some non-PMET occupations
Contrast that with service and sales workers.
Their median income moves from $3,000 at 25 to 29 to $3,358 at 35 to 39, before returning to $3,000 at 45 to 54.
Similarly, plant and machine operators earn around $2,700 at 25 to 29, approximately $3,000 through much of their 30s and 40s, and $2,300 from age 60 onwards.
This illustrates why age alone is an incomplete measure of whether somebody is earning “enough”.
The career earnings trajectory of a manager or professional can look fundamentally different from that of someone working in another occupational group.
Education Creates Another Major Divide
Occupation is not the only factor.
Educational attainment is also strongly associated with income, and the gap becomes particularly large later in a worker’s career.
Singapore’s labour force itself has become considerably more educated. In 2025, 64.1% of residents in the labour force had tertiary qualifications, compared with 51.5% in 2015. Degree holders accounted for 43.7% of the labour force, up from 32.2% a decade earlier.
MOM also found that 88.1% of degree holders aged 25 to 64 were employed in 2025, compared with 84.8% among those with diploma and professional qualifications and 81.4% among those with post-secondary non-tertiary qualifications.
The income differences are even more pronounced.
Median Salary Varies Across Different Qualifications For Different Age Groups
| Age | Below Secondary | Secondary | Post-Secondary (Non-Tertiary) | Diploma & Professional Qualification | Degree |
|---|---|---|---|---|---|
| 20–24 | S | $2,333 | $2,194 | $2,900 | $4,000 |
| 25–29 | $2,708 | $2,870 | $2,907 | $3,375 | $5,056 |
| 30–34 | $3,000 | $3,250 | $3,300 | $4,008 | $6,500 |
| 35–39 | $2,990 | $3,400 | $3,500 | $4,691 | $8,000 |
| 40–44 | $2,791 | $3,500 | $3,500 | $5,181 | $9,208 |
| 45–49 | $2,952 | $3,625 | $3,550 | $5,417 | $10,000 |
| 50–54 | $2,905 | $3,467 | $3,521 | $5,417 | $10,463 |
| 55–59 | $2,550 | $3,250 | $3,302 | $5,000 | $10,000 |
| 60 & Over | $2,145 | $3,000 | $2,880 | $4,550 | $8,667 |
| All ages | $2,383 | $3,200 | $3,172 | $4,460 | $7,876 |
S = data suppressed because of the small number of workers covered.
Source: Comprehensive Labour Force Survey, Manpower Research & Statistics Department, MOM.
The difference between degree and non-degree workers becomes progressively larger with age.
Among those aged 25 to 29, degree holders have a median income of $5,056, compared with $3,375 among those with diploma and professional qualifications.
By ages 35 to 39, the respective figures are $8,000 and $4,691.
And among those aged 45 to 49, the median for degree holders reaches $10,000, compared with $5,417 for diploma and professional qualification holders.
The median for degree holders peaks even later, reaching $10,463 among those aged 50 to 54.
This is particularly interesting when compared with the overall age data.
For Singapore workers as a whole, median income has already declined to $5,958 by ages 50 to 54.
Yet degree holders in that age bracket record a median of $10,463.
Degree Holders Appear To Maintain Higher Earnings Later In Their Careers
Another notable feature of the data is what happens after 50.
The overall median falls sharply from $6,608 among workers aged 45 to 49 to $4,410 at 55 to 59 and $2,970 from age 60 onwards.
The decline among degree holders is much less dramatic.
Their median remains $10,000 among those aged 55 to 59, before declining to $8,667 among those aged 60 and above.
Diploma and professional qualification holders aged 60 and above also record a median of $4,550 — considerably above the overall $2,970 median for workers in the same broad age bracket.
This does not establish that education alone causes the difference. Qualifications are closely connected with occupation, industry, career progression and other factors.
But the association in the MOM figures is substantial.
MOM separately reported that 78.9% of full-time employed resident degree holders were working in professional, managerial and executive roles in 2025.
So, Are You Actually Underpaid?
This is where salary comparisons need to be handled carefully.
Consider two 40-year-olds earning $6,000 a month.
Against the overall median of $6,750 for workers aged 40 to 44, both appear to be earning below their age-group benchmark.
But suppose one works in clerical support, where the median is $3,375, while the other is a manager, where it is $10,833.
Their $6,000 salaries suddenly look very different.
Education changes the comparison again.
A 40-to-44-year-old diploma or professional qualification holder has a median income of $5,181, while the corresponding figure for a degree holder is $9,208.
Simply knowing someone’s age and salary therefore tells us relatively little about whether that person is highly or poorly paid.
Singaporeans Typically Reach Their Highest-Earning Years In Their 40s And 50s
The broader pattern across the three sets of data is nevertheless clear.
For the overall population, median income rises rapidly during the 20s and 30s and reaches its highest point in the early 40s.
But among some higher-paying occupational and educational groups, the peak comes later.
Managers and administrators reach their highest median of $11,925 between 50 and 54, while degree holders reach $10,463 in the same age bracket.
This suggests that the commonly held idea that earnings simply peak at 40 does not apply equally to everyone.
Career progression for professionals and managers can continue producing substantial income gains into the late 40s and early 50s.
MOM’s wider labour-force data also shows how Singapore’s workforce is changing. In 2025, 71.8% of employed residents aged 45 to 54 were in PMET roles, compared with 49.9% among those aged 55 to 64. The younger group was also substantially more likely to be tertiary educated — 69.9%, compared with 42.0% among those aged 55 to 64.
This means some of today’s differences between age groups reflect differences between generations as well as the effects of ageing itself.
Salary Benchmarks Are Useful — But They Are Not A Career Scorecard
The most useful way to read these numbers is not to treat them as targets that everyone must hit.
A 35-year-old earning less than $6,250 is not automatically underpaid simply because that is the median for workers aged 35 to 39.
Similarly, somebody earning substantially above the national median of $5,000 may still be earning below the typical salary for their occupation, qualification and experience.
Instead, MOM’s figures provide different layers of context.
Age tells you broadly where you stand. Occupation makes that comparison more meaningful. Qualification adds another important dimension.
And even then, factors such as industry, job responsibilities, experience, performance and specialised skills can produce significant differences between individuals.
So rather than asking only:
“Am I earning more than the average Singaporean?”
A more useful question may be:
“How does my salary compare with people at a similar stage of their careers, doing similar work and with similar qualifications?”
That comparison is far more likely to tell you whether your salary is really keeping pace.
Source: Ministry of Manpower, Labour Force in Singapore 2025. Income figures refer to median gross monthly income from employment of full-time employed residents, excluding employer/platform operator CPF contributions. Data excludes full-time National Servicemen. MOM’s 2025 report is based on the Comprehensive Labour Force Survey, which sampled 33,000 households.